Mapping the US–Mexico bilateral relationship
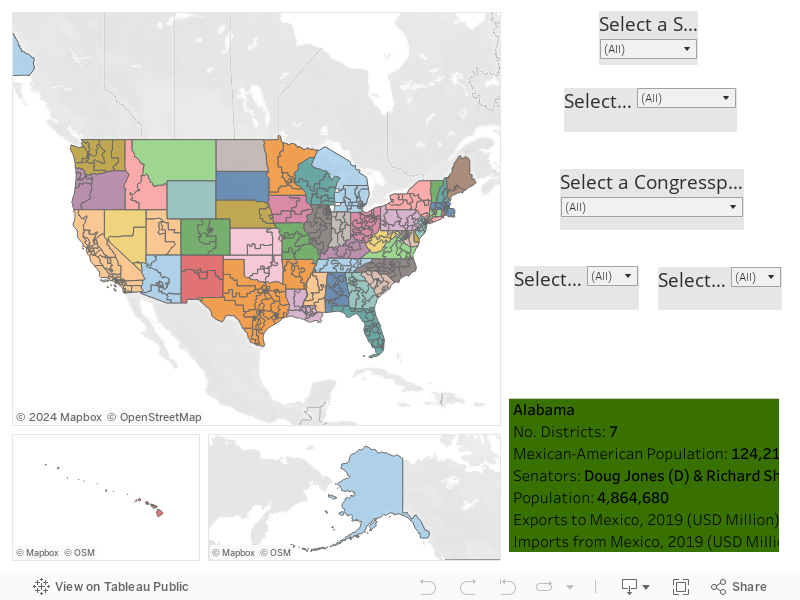
An interactive map of 436 US Congressional Districts — political, demographic, and trade data from every angle of the US–Mexico relationship.

While interning for the Mexican Embassy in the USA in the summer of 2020, I was tasked with creating an interactive map which breaks down all 50 states by Congressional District and displays political, demographic, and trade information pertaining to Mexico.
I created this map by first merging a shape file containing the 436 relevant districts with US Census data, commercial data, and each state and district's politicians. I inputted this dataframe into Tableau to create the interactive map below. It will soon be published on the Mexican Embassy's website, and the factsheets I also created for each district will soon be integrated into the map.
Press Shift and drag the cursor on the map in order to pan.